Google Maps API v2 - Custom Tiles
Introduction
Google maps API Version 3 has been designed and optimized with mobile devices in mind, as such - it offers a smaller API for interacting with Google Maps. We chose to use Version 2 of the API because, at the time of programming, v3 was still in beta and lacked the robust features of v2 that allowed for more precise control over the map and plays well with Google Street View.
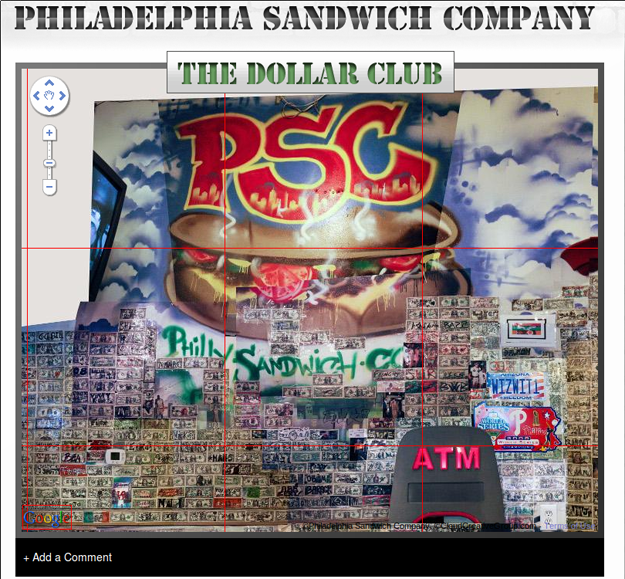
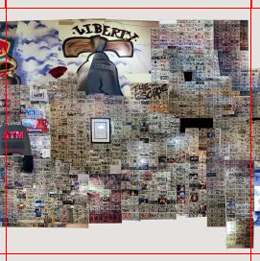
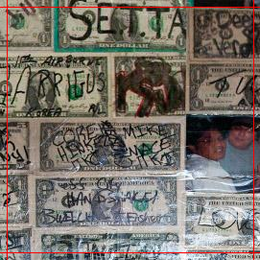
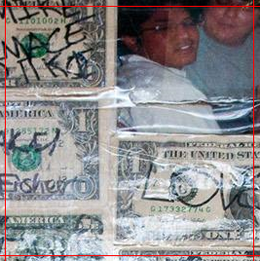
The Dollar Wall creates an unrivaled atmosphere for anyone who sets foot in the Philadelphia Sandwich Company's restaurant. We wanted to reproduce this unique setting inside their website. By leveraging Google Map's open API, we not only allow people to see what covers 3 walls and the ceiling, but we also created a commenting system that allows anyone to stick a virtual pin on the wall and leave a comment for the whole world to see. Before continuing, check out the real world implementation of this code here.
Prerequisites
In order to load version 2 of the Google Map's API on your website, you must generate an API key. This key can be obtained by visiting http://code.google.com/apis/maps/signup.html and registering your domain name. Follow the instructions for copying and pasting the generated code into your project.
Generating the Image
We began by taking pictures of the entire wall and ceiling. The images were manually stitched together to form a very high resolution, very large image of the wall and ceiling using Photoshop on a Mac. The final PSD file was 23,000 x 8,980 pixels totaling 1.32 gigs in size. This is the image file that was repeatedly shrank and run through the python image processing script to produce the tiles for the map overlay at each zoom level.
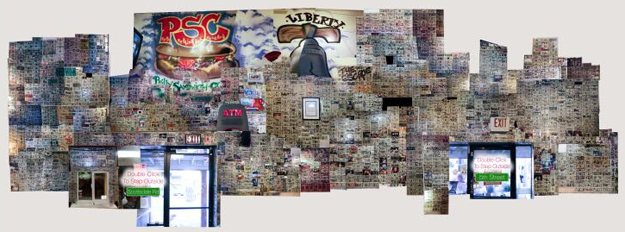
Image Processing
In the Maps v2 API, all of the tiles measure 256x256 pixels. Additionally, all of the tiles that are going to be utilized in the map must be organized into zoom levels. Each zoom level starts with an image that is a resized version of the original, shrank usually by 4 times. The Maps coordinate system uses a projection of the tiles where the upper left corner of the upper left tile is the origin, X increases to the right, and Y increases downwards. Check out the Google Maps API documentation for a more in-depth explanation here (http://code.google.com/apis/maps/documentation/javascript/overlays.html#CustomMapTypes). This allowed us to write a simple python script to automate cutting out the tiles from the different images at different zoom levels.
cutImage.py
#! /usr/bin/env python

import Image
import math

image1 = Image.open("wall_image.jpg")

numX = image1.size[0]/256
numY = image1.size[1]/256

left = 0
upper = 0
right = 256
lower = 256

for y in range(0,numY):
    for x in range(0,numX):
        cropped = image1.crop((left, upper, right, lower))
        cropped.save('%s,%s.jpg' % (x,y))
        left = left + 256
        right = right + 256
    left = 0
    right = 256
    upper = upper + 256
    lower = lower + 256
Before using this script, you must make sure the image has a length and height divisible by 256 without a remainder, or the edges of your image will be cut off. If your dimensions are not evenly divisible by 256, use the following formula to resize your canvas with Photoshop or Gimp:
NewCanvasLength=Length+(256-(Length%256))
Maps API
Copyright
In order to begin replacing the tiles in Google Maps, you must create a copyright object and add it to a copyright collection. The copyright objects are what will be displayed on the bottom of the map within the given copyright boundaries. You can create as many copyright objects as you want inside of your copyright collection. Start by creating and assigning GCopyright objects, then adding them to a Copyright collection. This sample shows making two GCcopyright objects and adding both of them to a variable called copyCollect:
// setup the copyright for the bottom right of the map
var copyrightC2G = new GCopyright(1,
           new GLatLngBounds(new GLatLng(-90, -180),
           new GLatLng(90, 180)),
           0,
           "©CloudCreativeGroup.com");
var copyrightPSC = new GCopyright(2,
           new GLatLngBounds(new GLatLng(-90, -180),
           new GLatLng(90, 180)),
           0,
           "©Philadelphia Sandwich Company");
var copyCollect = new GCopyrightCollection();
copyCollect.addCopyright(copyrightPSC);
copyCollect.addCopyright(copyrightC2G);
The code above produces the following copyright overlay in the bottom right corner of the map:

Replacing the Tiles
The getTileUrl function is used to return each tile at the given zoom level. It can be implemented to fit the specific needs of your map, and information it uses can come from a database or from a directory. The function receives the zoom level and coordinate of each tile as an argument. The GTileLayer object takes the copyright collection, and the minimum and maximum zoom levels for the map as arguments. We chose 4 and 9 to be the min and max so we could later expand the map in either zoom direction if needed without modifying the files in place. This zoom argument will provide the range for the zoom control on your map. You can see from the function that each tile is in a folder with its zoom level and has a file name that is X,Y.jpg.
// return the tiles for the new map type
var dollarTiles = [new GTileLayer(copyCollect, 4, 9)];
dollarTiles[0].getTileUrl = function (coord, zoom) {
    return "/media/images/maps/" + zoom + "/" + coord.x + "," + coord.y + ".jpg";
};
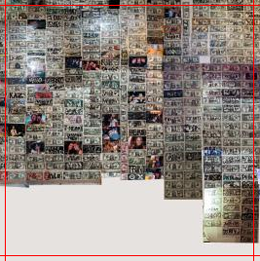
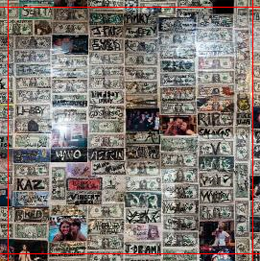
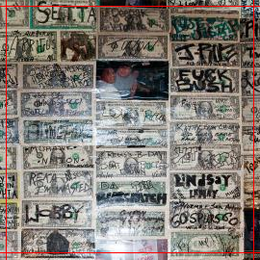
The images below are pictures of individual tiles at different zoom levels. All of these tiles will be provided individually by the function above.
Map Object
Now that we have all the tiles ready to go, we have to create a GMapType object to hold our custom map type. We then create a map object and add our custom map type to the map object. Google maps is a flattened map of the world and therefore utilizes a Latitude and Longitude coordinate system for defining points within the map. Since Latitude and Longitude will have no distinct correlation with the custom tiles in our map, we must provide the conversion between Latitude/Longitude and arbitrary points on our final map. This is accomplished by utilizing the same Mercator projection Google utilizes within the map, which can be accessed by creating a GMercatorProjection object. More info on how the Mercator projection works here (http://en.wikipedia.org/wiki/Mercator_projection).
// setup the map type to hold the new tiles
var dollarMapType = new GMapType(dollarTiles,
        new GMercatorProjection(14),
        "Image",
        {errorMessage:""});

// create and initialize the map object
map = new GMap2(document.getElementById("map_canvas"));
map.addMapType(dollarMapType);
map.setCenter(new GLatLng(84.3995116971245,-160.7080078125), 6, dollarMapType);
map.addControl(new GLargeMapControl3D());
Commenting System
MarkerManager
By itself, replacing the tiles in a Google map with custom tiles has many applications. In order to provide a true level of interaction with this new map, we leveraged the marker and infowindow objects to provide an interactive commenting system for the end user. This gave users the ability to create new content within the map. To guarantee scalability, we had to utilize the MarkerManager provided by the Google Maps Utility Library to handle creating and displaying all the markers and comments on the map. The MarkerManager dynamically loads all the markers within the current viewport and provides a buffer outside of the viewport (we set to 100 pixels) to load markers into for smooth scrolling around the map. It also handles displaying a different set of markers at each zoom level.
// setup the marker manager to hold the markers
var mgrOptions = { borderPadding: 100, maxZoom: 9 };
mgr = new MarkerManager(map, mgrOptions);
markersArray
All of the markers to be displayed on the map are stored in a database with their coordinates and the content for the infowindow bound to each marker in HTML. The addMarkersFromDB function is called from a loop that iterates through each comment in the database and adds it to markersArray.
// add markers (with custom icons) and infoWindows to markersArray
function addMarkersFromDB(point, html) {
    var gpoint = eval('new GLatLng('+point+')');
    // setup the custom marker
    var pscIcon = new GIcon(G_DEFAULT_ICON);
    pscIcon.image = "/media/images/maps/pscIcon.png";
    pscIcon.shadow = "/media/images/maps/pscIcon_shadow.png";
    pscIcon.iconSize = new GSize(22,33);
    pscIcon.infoWindowAnchor = new GPoint(22,1);
    markerOptions = { icon:pscIcon };

    var markerFromDB = new GMarker(gpoint, markerOptions);
    markerFromDB.bindInfoWindowHtml(html);
    markersArray.push(markerFromDB);
}
markerRefresh
In order to get the markers in the markersArray to display on the map, it has to be added to the markerManger. The markerManager arguments allowed us to hide the markers on zoom levels 4-6 (our map starts at zoom level 4) and only display the markers on levels 7-9. This was built for scalability so when the map becomes saturated with markers, they won't obstruct your view of the map at zoomed out levels.
// add the markersArray into the marker manager to display on the map
// set the minZoom and maxZoom for the markers to be displayed
function markerRefresh() {
    mgr.addMarkers(markersArray, 7, 9);
    mgr.refresh();
}
addComment
The addComment function is restricted to only showing one marker for adding comments on the map at a time. It first checks a Boolean variable to see if there is a marker on the map. The HTML inside the infowindow is a form for the user to fill out with their comment and contact information. Upon submitting the comment information, the field forms are validated and then added to the database.
// add a dragable marker to the map for a comment
function addComment() {
    if(!pinDropped) {
        pinDropped = true;

        commentMarker = new GMarker(map.getCenter(), {draggable: true});
        map.addOverlay(commentMarker);

        infoDiv = document.createElement('div');
        infoDiv.innerHTML = '<div id="commentFormBox"><form id="commentForm" action="/dollar-club/add-comment/" method="post">'+
            '<label for="name">Name</label><input id="comment_name" type="text" name="name" /><br/>'+
            '<label for="email">Email</label><input type="text" name="email" /><br/>'+
            '<label for="comment">Comment</label><textarea id="comment_comment" name="comment"></textarea><br/>'+
            '<input type="hidden" id="comment_latlng" name="latlng" value="" /><input type="submit" value="Add Comment" />'+
            '</form></div>';

        commentMarker.openInfoWindow(infoDiv);


        GEvent.addListener(commentMarker, "dragend", function() {
            commentMarker.openInfoWindow(infoDiv);
        });

        GEvent.addListener(commentMarker, "infowindowclose", function() {
            commentMarker.bindInfoWindow(infoDiv);
         });

        GEvent.addListener(commentMarker, "infowindowopen", function() {
            $('#commentForm').validate({
                rules: {
                    name: "required",
                    email: {
                        required: true,
                        email: true
                    },
                    comment: "required"
                },
                submitHandler: function(form) {
                    $('#comment_latlng').val(commentMarker.getLatLng().lat()+','+commentMarker.getLatLng().lng());
                    $.post('/dollar-club/add-comment/', $('#commentForm').serialize(),
                        function(data){
                            success = parseInt(data);
                            if (success > 0) {
                                commentMarker.disableDragging();
                                commentMarker.openInfoWindowHtml('<strong>'+$('#comment_name').val()+'</strong>'+$('#comment_comment').val());
                            }
                        });
                    return false;
                }
            });
        });

     }
  }
Tools
Code
The addInfoMarker function puts a marker on the map with an infowindow that contains information about the tile that the marker falls within. It is useful for information gathering when building and debugging the replacement tiles.
function addInfoMarker() {
	var marker = new GMarker(map.getCenter(), {draggable: true});
	map.addOverlay(marker);

	var tileCoordinate = new GPoint();
	var tilePoint = new GPoint();
	var currentProjection = G_NORMAL_MAP.getProjection();
	tilePoint = currentProjection.fromLatLngToPixel(marker.getLatLng(), map.getZoom());
	tileCoordinate.x = Math.floor(tilePoint.x / 256);
	tileCoordinate.y = Math.floor(tilePoint.y / 256);

	// initial infoWindow HTML
	var initialHtml = "Latitude: " + marker.getLatLng().lat() +
		"<br/>Longitude: " + marker.getLatLng().lng() +
		"<br/>The Tile Coordinate is:<br/> x: " + tileCoordinate.x +
		"<br/> y: " + tileCoordinate.y +
		"<br/> at zoom level " + map.getZoom();
	marker.openInfoWindowHtml(initialHtml);

	// re-open infoWindow after dragging pin
	GEvent.addListener(marker, "dragend", function() {
		var myHtml = "Latitude: " + marker.getLatLng().lat() +
			"<br/>Longitude: " + marker.getLatLng().lng() +
			"<br/>The Tile Coordinate is:<br/> x: " + tileCoordinate.x +
			"<br/> y: " + tileCoordinate.y +
			"<br/> at zoom level " + map.getZoom();
		marker.openInfoWindowHtml(myHtml);
	});
}
Firefox Web Developer Toolbar
After installing the Firefox Web Developer Toolbar, selecting (Images -> Outline Images -> All Images), all of the individual tiles in your map will be outlined with a red line. This can be useful for building and debugging your custom tiles.