
A Look at Facebook Five Years Later
We are the generation who grew up with pagers, not cell phones. We grew up with fax machines and dial-up internet; before email was in our pocket. Mario was on TV, and computers were never far from reach. We are a technology-oriented generation; this is how we used cutting-edge technology to study our own interaction on Facebook.
Based around analyzing extremely large data sets, Hadoop is a programming paradigm still in its infancy. This makes it a suitable platform for mapping out human interaction patterns on computers that, by facilitating the domain for interaction, inherently have the ability to log all user interaction within the domain.
Our data set spanned the complete walls of 409 Users with the oldest post made on 11/1/2004 and the latest occurring on 3/30/2009. The data set consisted of 227,228 Unique Posts with 76,258 consisting of Status Updates. Of the 409 complete walls, only three were completely blank.
The Technology Infrastructure has advanced to the point where people no longer operate their computers at maximum hardware capacity. This has paved the way for ubiquitous access to data, which requires the collection and storage of all available information. We have begun moving back towards old tools meant for dealing with data processing at the top of their capacity. Bell Labs created Awk in the ‘70s to organize large data sets. The most popular websites on the World Wide Web have massive data sets requiring large data management operations. When this level was reached in the ‘70s, the true potential of computers became evident and their decades of adoption began. Despite the constant quest to build larger and larger computers that utilize more and more precise instruments over the past thirty years, we are once again at a point where the data outweighs the processing abilities of our current personal technology.
Cloud Computing has become the most viable solution to our growing information problem. This new process keeps all the data “in the cloud,” where it can be dealt with on a massive scale and deliver slices of it to clients.
Posts per Day
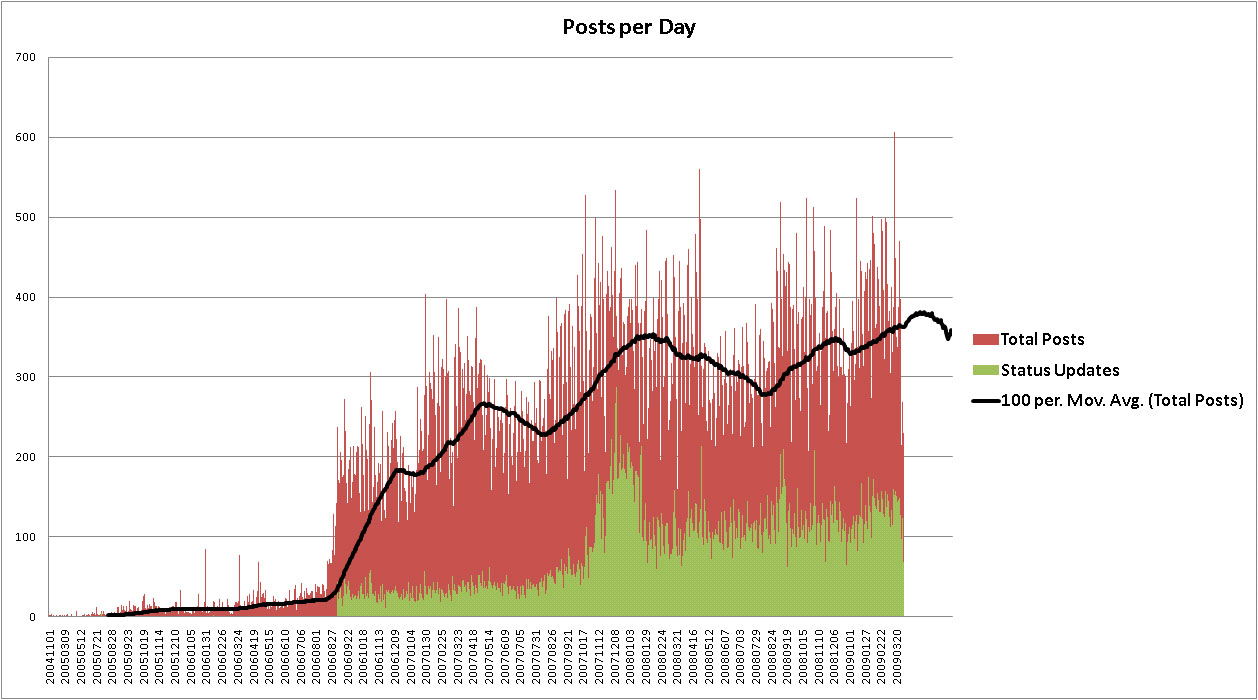
This graph shows the number of people making Wall Posts versus making Status Updates. Facebook introduced the News Feed on September 6, 2006, at the beginning of the Status Updates (green) in the above graph. By allowing you to see the activity of all of your friends in real-time, this feature had a massive impact on our sample group. We believe the News Feed alone is responsible for facilitating Facebook’s colossal amount of daily traffic. On October 24, 2007, Microsoft purchased a 1.6% share of Facebook for $240 million. This purchase gave Microsoft the ability to implement international ads. Just prior to the purchase, Facebook introduced the ability to attach files to posts in July 2007. We believe this was responsible for stimulating the peak in Status Updates during late 2007 and into early 2008.
The default question Facebook asks for the Status Update has changed since its introduction, moving away from a third-person description of your actions to a more direct personal question. Facebook originally prompted the status update with “[Persons’ name] is...,” followed by the user’s Status Update. However, on December 13, 2007, the requirement to start a status update with “[Persons’ name] is...” was removed. The question, "What are you doing right now?" was introduced. In March 2009, the status update question was changed once again from "What are you doing right now?" to "What's on your mind?" {Note: date information obtained from Wikipedia}.
Day of the Week Breakdown

This pie chart shows the daily activity of Wall Posts and Status Updates from our sample size of users. With 17% of user activity, Monday is the prime day where most people interact on Facebook. Tuesday and Wednesday are also high volume days at 16% each. As the week progresses, volume begins to dip, with the lowest point at 10% of user volume on Saturday. This is sensible because most of our sample consisted of college-aged young adults - Friday and Saturday are prime days to go out for the night and party with your friends, allowing you to have something worth mentioning for Monday. We see a 4% increase in user volume on Sunday over Saturday. This could be because most people need to recover from Friday and Saturday as work or school begins on Monday. This pie chart is a simple visualization of usage behaviors for a particular subgroup of individuals on Facebook who all share highly correlated behaviors and interests. As such, this pie chart is a fair representation of approximating their behavior.
It is important to note that this pie chart was created before smartphones had permeated well into the college-aged crowd. In the future, it would be interesting to recreate this graph with usage data from smartphone users having a Facebook app that makes it easy to chat and post things from anywhere with web access. Also, it would be interesting to see if Facebook usage has increased or decreased with time, as a consequence of negligible growth and the emergence of competitors like Twitter or other subculture-focused social-networking sites.
Hourly Breakdown

This graph shows the hourly posts for each day, with 0 being midnight and 23 being 11PM. Each of the bars corresponds to a day of the week. This graph is designed to give you a clear idea of the volume of posts at a particular hour for each day. During the morning, we see that most of the posts occur on Monday during 9AM to 11AM. Posting drops off during the lunch hour around noon, but, surprisingly, quickly jumps back up around 1PM (13:00HR). We also see a spike around 8PM (20:00HR) to 10PM (22:00HR), which is typically the peak hours of usage. User activity proceeds to drop off from midnight (00:00HR) until 4AM (04:00HR), the lowest period of activity. Ironically, this pattern does not model the time cycle of a college student, who would be doing things late at night or during a break in their class schedule. From 1PM to 6PM, posting is fairly high and consistent for Mondays. Interestingly, Friday postings peak at 11AM and proceed to drop off sharply until Saturday morning. Posting volume for Sunday and Tuesday increased from 1PM to 10PM. It is clear from the visualization that many trends can be proposed about Facebook usage for each time of each day. This is a great way to find out when to run ads to appeal to your desired demographic or post to your feed in order to reach the maximum number of people available. This sort of analysis is critical to generating revenue on Facebook.